- Detailed Explanation of the Finite Element Analysis (FEA) ProcessPreProcessingPre-Processing is the initial step of the Finite Element Analysis (FEA) simulation process. This crucial stage involves preparing the CAD model and setting up the simulation to ensure accurate and efficient analysis. Key activities during pre-processing include:
Geometry Cleaning and Simplification: Simplifying the CAD model by removing unnecessary details to reduce computational complexity.
Meshing: Dividing the geometry into smaller, finite elements. This process, known as meshing, is essential for discretizing the geometry to solve the equations.
Material Properties: Assigning material properties to the different components of the model. This includes defining attributes such as density, elasticity, and thermal conductivity.
Boundary Conditions and Loads: Specifying the boundary conditions, constraints, and external loads applied to the model. This step ensures the simulation reflects real-world conditions accurately.
Solver
The Solver stage involves running the simulation using specialized algorithms to approximate the solution to the defined problem. The solver employs iterative numerical procedures to solve the equations governing the physical phenomena. Key aspects of the solver stage include:
Algorithm Selection: Choosing the appropriate algorithm based on the type of analysis (static, dynamic, thermal, etc.).
Solution Convergence: Ensuring that the solution converges to an acceptable tolerance level, meaning the results are stable and reliable.
Computational Efficiency: Optimizing the solver parameters to achieve a balance between accuracy and computational time.
Post-Processing
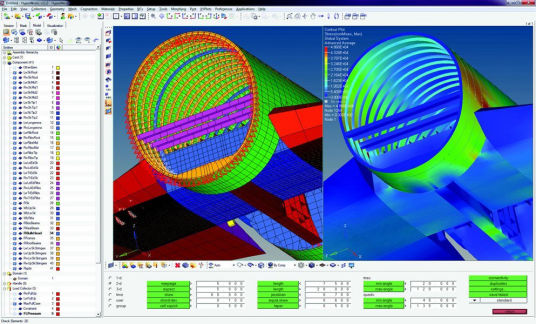
Post-Processing is the final step of the FEA process, involving the extraction and visualization of results. This stage is critical for interpreting the simulation data and making informed engineering decisions. Key activities during post-processing include:
Result Extraction: Extracting desired flow properties or structural results from the simulation, such as stress, strain, temperature distribution, and flow velocity.
Visualization Tools: Using visualization tools to represent the results graphically. Common methods include:
Contour Plots: Displaying the distribution of a specific variable across the model.
Vector Plots: Representing the direction and magnitude of vector quantities such as displacement or velocity.
Streamlines: Visualizing the flow paths in fluid dynamics simulations.
Data Curves: Plotting specific variables against time or other parameters to analyze trends.
Popular post-processing software includes HyperView and ANSYS Post, which offer advanced visualization capabilities and reporting tools.